Why a calculator?
You tell a manager that your work will save them time. They nod politely. Then you let them move a slider for the team size and watch a number grow, a number that is theirs. Nobody argues with their own numbers.
A calculator turns a vague problem into a number the visitor believes, because they set the assumptions. I built one for the 21 Dimensions retreat days: it asks about team size and lost days, and shows what a day that helps avoid just a few percent of the hidden cost is worth.
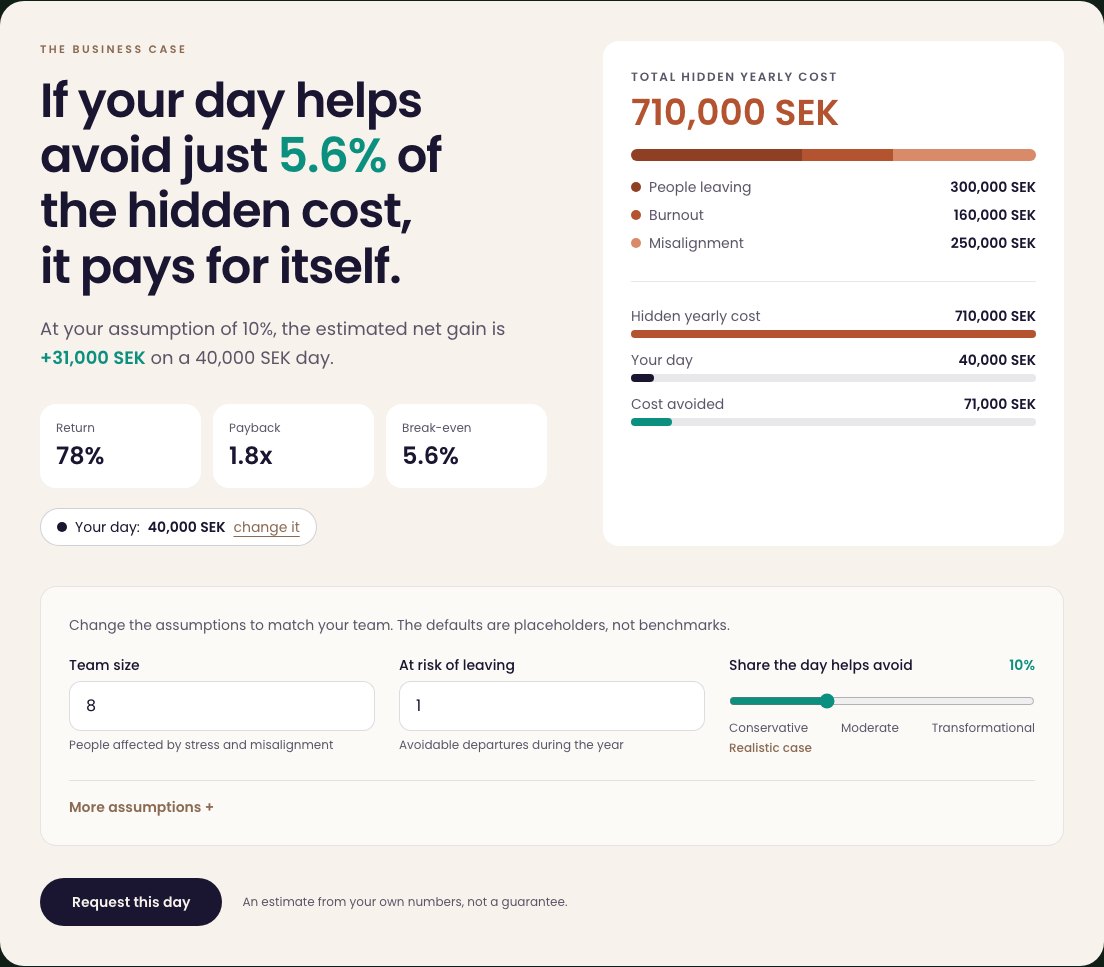
How do I build one that people trust?
- Three to five inputs the visitor can change, with plain-word explanations.
- Every formula visible in a small “how this is calculated” panel.
- Starting values labelled as placeholders, not benchmarks. Do not present invented numbers as facts.
- A result in one big number, with the working shown below it.
- One button to ask you about it, with the visitor's numbers filled in.
A calculator in five sliders
An invented example, so you can feel how it works. The numbers are placeholders, not benchmarks.
Avoided at your assumption: 12,000 SEK
The offer pays for itself 0.3×
hidden cost = people × day cost × days lost. avoided = hidden × share.
Build a calculator that shows what [problem] costs a team and what it pays to reduce it. Inputs the visitor can change: team size, cost of a working day, days lost per person per year, the share they think could be avoided, and the price of my offer. Show: the hidden yearly cost, the amount avoided at their assumption, and how many times the offer pays for itself. Explain every assumption in plain words next to its field. Mark the starting values as placeholders, not benchmarks. End with one button that lets the visitor ask me for the offer with their numbers filled in. Use BRAND.md. Keep every formula visible in a small "how this is calculated" panel.
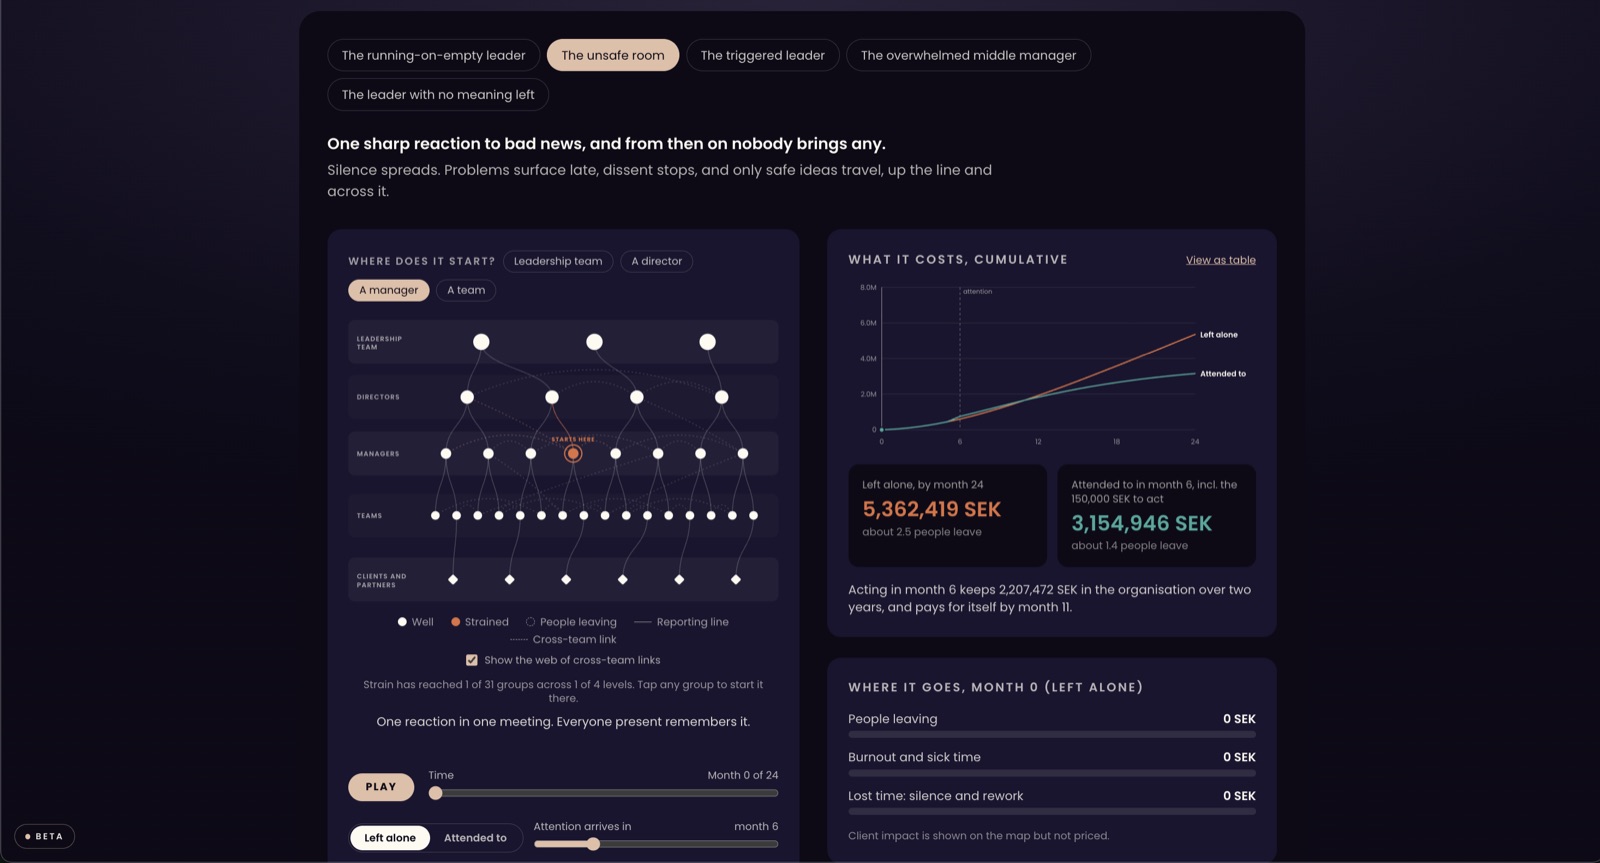
What is a ripple map?
A ripple map shows how something spreads through a group. On the Agentverkstad site I built one for AI adoption: each dot is a group of people, the redder it is the more hesitation, and lines show who reports to whom and how the work really hangs together. You pick a bottleneck and watch hesitation start in one or two groups and spread. The model comes from the Ripple work I did for 21 Dimensions.
Build a ripple map for [problem] in an organisation with four levels: [levels]. Each dot is a group of people. Let me pick a starting point and a link strength, and show how the effect spreads along the reporting lines and the informal links, with the colour showing the strength. Show the number of groups reached. Label it as an illustration, not a prediction. Use BRAND.md.
What other maps can I build?
- A stakeholder map: who decides, what they value and what holds them back.
- A framework map: an interactive view of a model people need to explore, like the five dimensions and skills of the Inner Development Goals.
- A journey map: the steps a client takes, with what they feel and need at each.
- A balance wheel: how a day, a week or a team is spread across areas.
For a company I have built maps like these as part of a programme. Nothing here is a prediction: they make a pattern visible so people can talk about it.
What becomes possible?
A calculator or a map can be the entry point to a whole service.
- A calculator that every proposal links to, with the client's numbers.
- A free tool people find by searching, which leads to a conversation.
- A map used in a workshop, projected, with the room answering together.
What does the problem I solve cost my client, in money, time or energy? Suggest a calculator and a map I could build: the inputs, the formulas, what the map would show and what each would lead to. Mark every figure as an assumption. Rank by how quickly I can build it.
Questions people ask
Can I trust the numbers a calculator gives?
Only as much as the assumptions. That is why the formulas are visible and the starting values are labelled as placeholders. The visitor's own numbers are what matter.
How long does it take to build?
A simple calculator takes an evening with an agent. A ripple map takes longer, mostly deciding what the dots and links mean.

Who is writing this
I am Nathaniel, a commercial operator. For twenty years, across four continents and more than fifteen ventures, I have taken research and young companies from idea to customer. Two KTH spin-offs reached joint development agreements with Fortune 500 partners. An indoor farm sold its full production within about ninety days and ended in a joint venture exit. This year I am a commercial expert for the European Innovation Council's Tech to Market programme. Now I build agents, because the hard part of new technology is rarely the technology. It is getting people to want it and use it.
Want to do this together?
In two hours I can build this with you: Calculators and ripple maps.